

Crypto tokens are the most talked-about part of any blockchain for the general public. Lots of money is being moved on a blockchain in the form of tokens. This is because tokens can be used in exchange for utility on the blockchain, whether it's an NFT, storage, or smart contract execution.
In this article, we will analyze some token data and examine the amount of tokens traded for a given period. We will explore how to use Bitquery Explorer to see token data with just a token address. Also, we will use the Bitquery GraphQL API to fetch these details in the BitQuery IDE. For the scope of this article, we will use "USDT" as the token and analyse it.
Getting Started
To get started, please create an account on BitQuery or log in if you already have an account. It will be useful if you want to run your query with the GraphQL API. BitQuery provides a free plan for developers, which is enough for testing. Check out the Pricing here.
If you are completely new to BitQuery or GraphQL, you can check out the video below. But yes, I will be explaining everything in the article below even if you didn't watch the video.
BitQuery Explorer
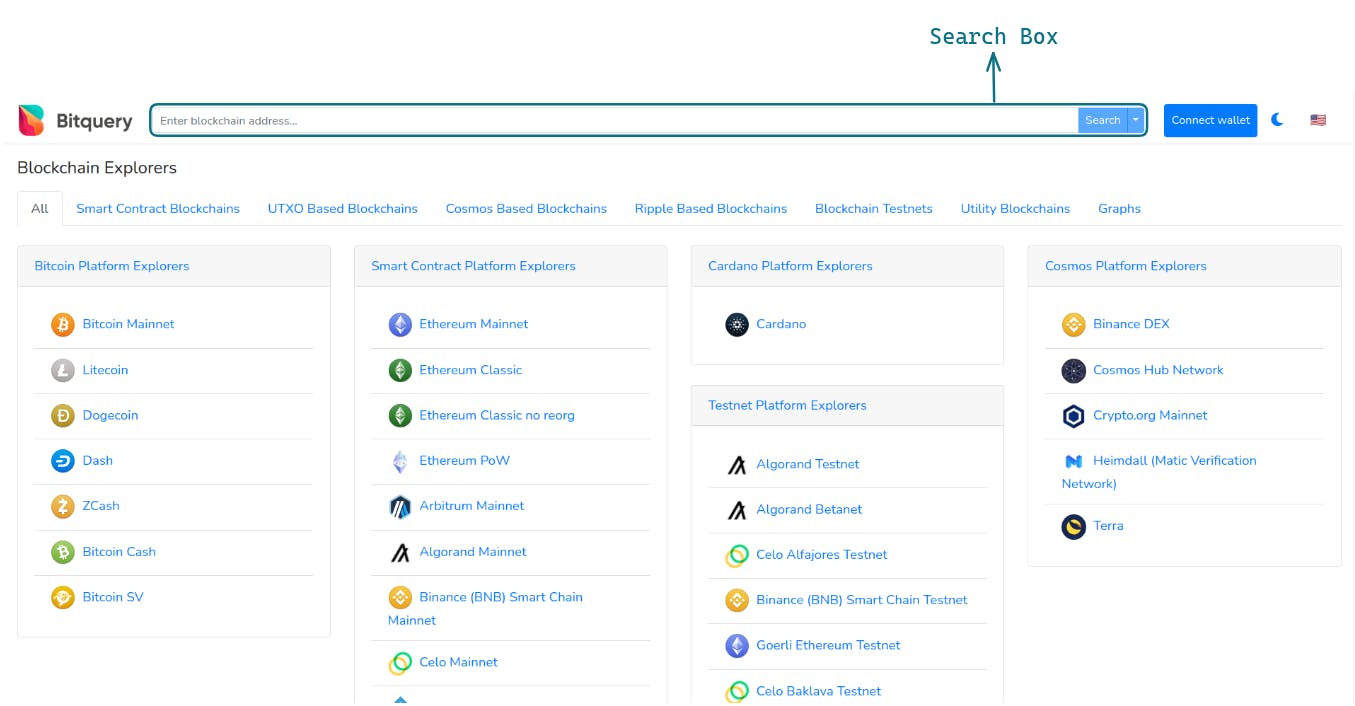
On BitQuery Explorer, we can check different chains or put an address in the search bar to get more details about it. It can be a smart contract address, token address or wallet address.
Let's put a "USDT" address on the search bar and see what we get. A token can be present on multiple chains (eg: Ethereum, Matic, Solana, BSC etc...) and it will have different token addresses on different chains. Here I will use the "USDT" address on the Ethereum chain i.e. 0xdA....31ec7.
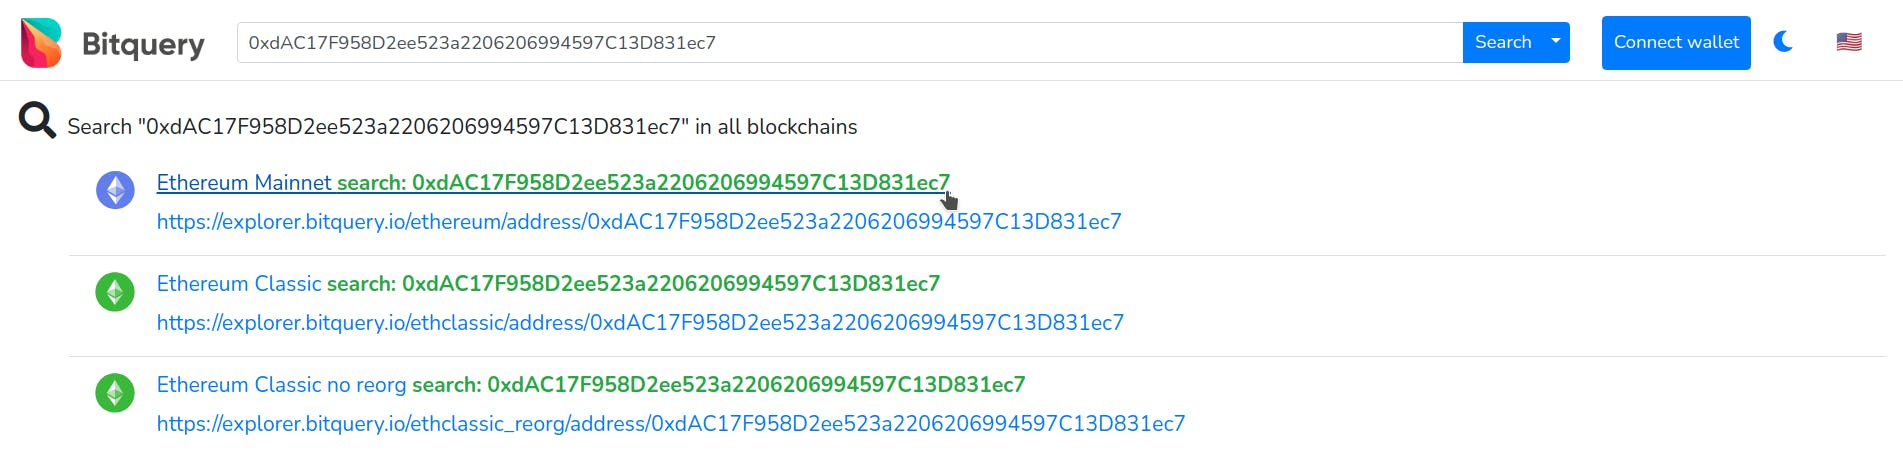
There might be a lot of matches for the same address but as we know it's an Ethereum Mainnet address, we have to select the correct one. You can verify the token attributes if there is any misunderstanding.
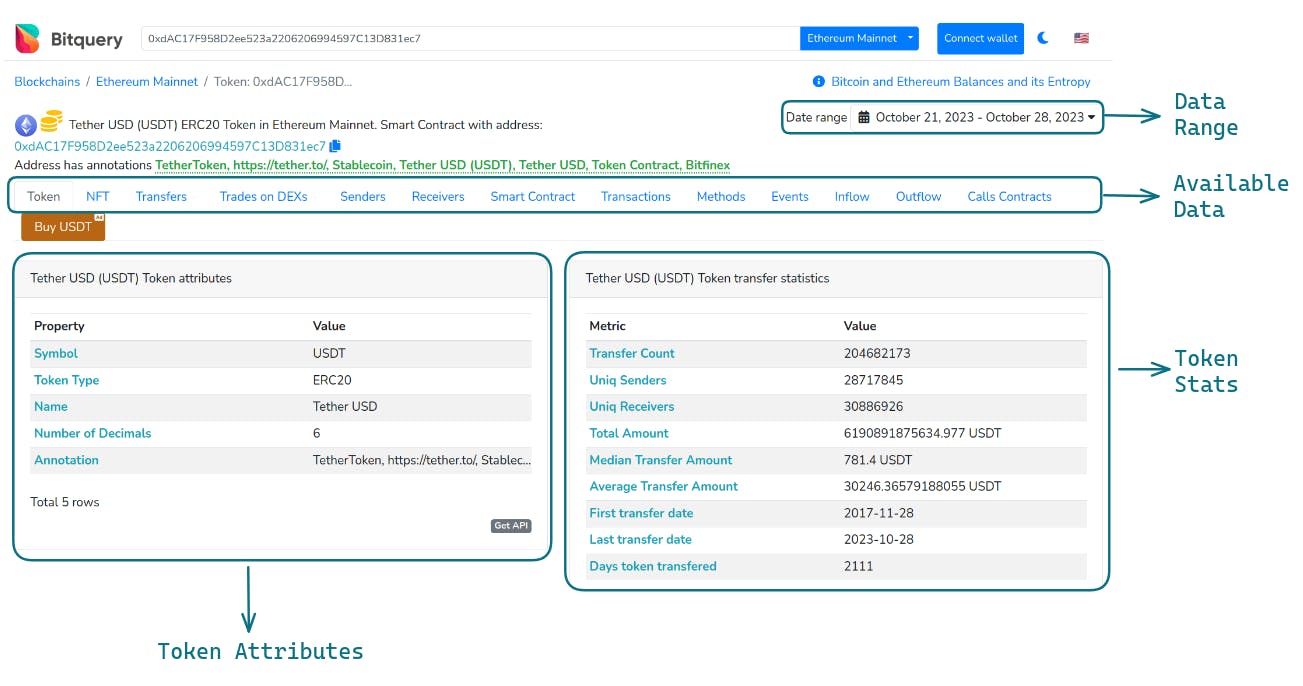
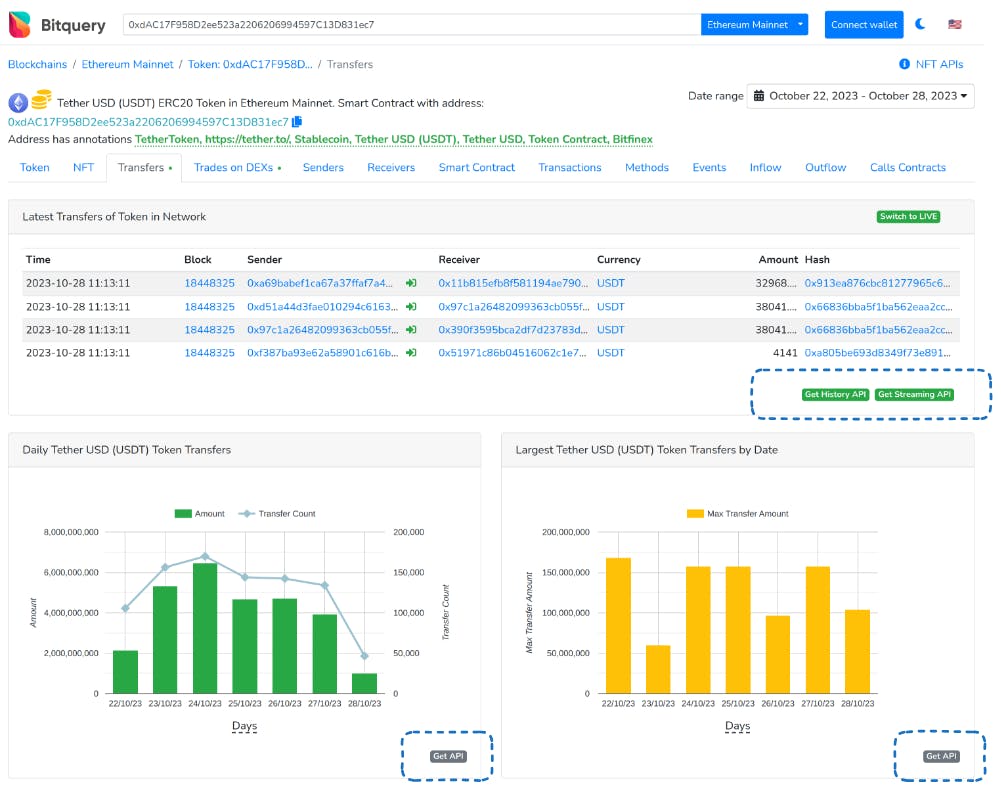
Within the Explorer, you can check a lot of data including transfers, trades, smart contract events, calls and more. Let me show you how to check "DEX Trades". Click on the Trades on DEX's tab and select a date range to get data based on the range.
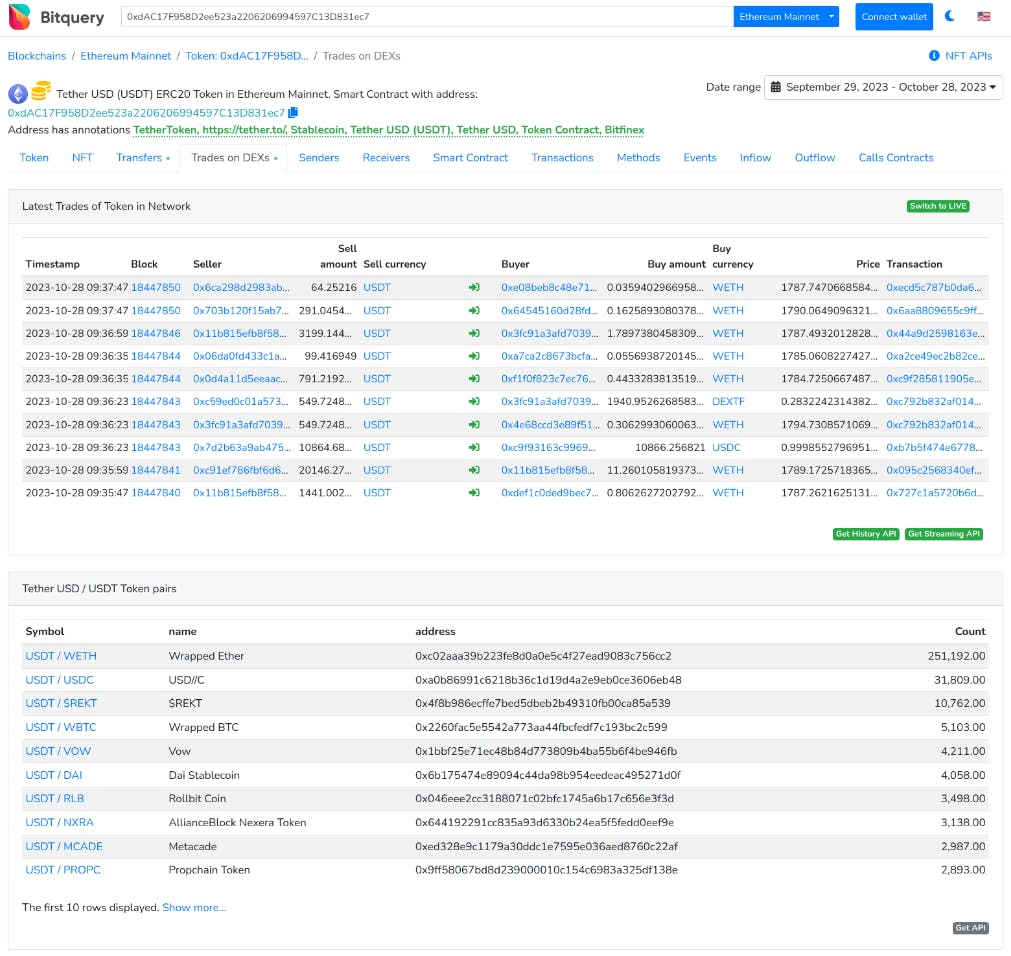
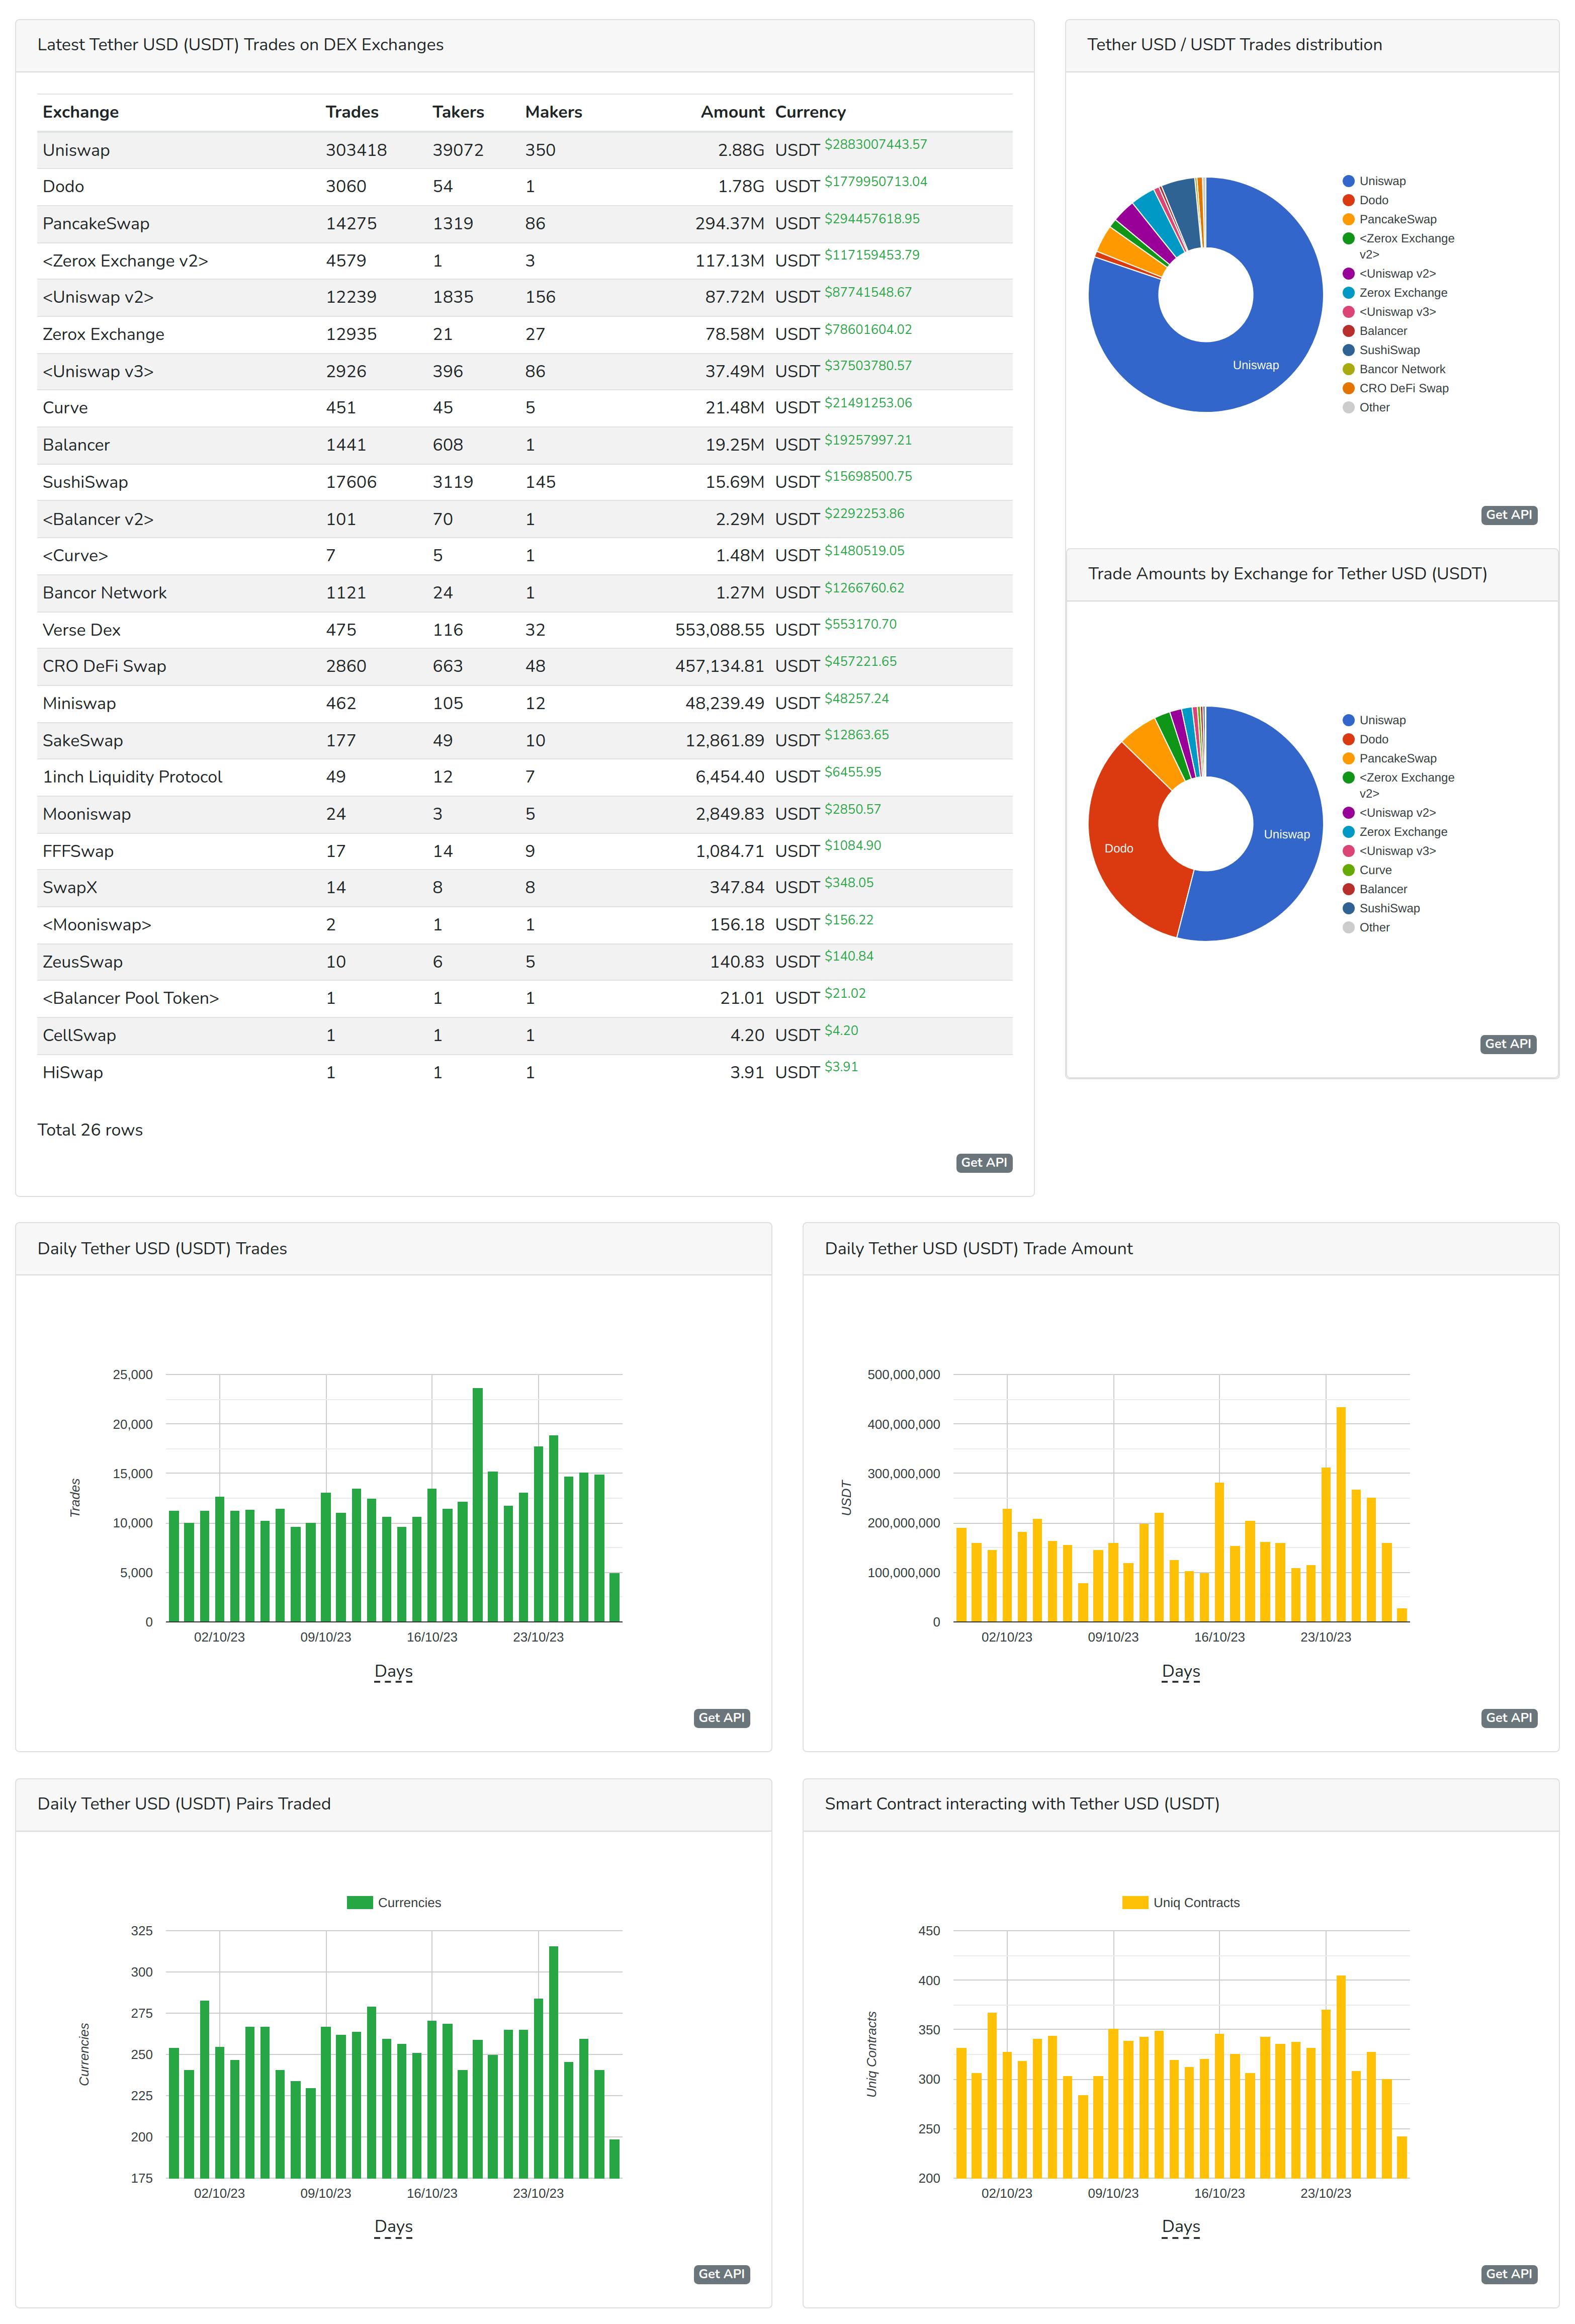
The data above is for the past 30 days and shows the most recent transaction, how much USDT was traded on various exchanges, daily statistics, and more. From this data, we can see that USDT trades increased a lot on October 24th and normally it's 10k-15k trades.
Similarly, if we check the "Transfers" tab, we can see how many "USDTs" are transferred daily.
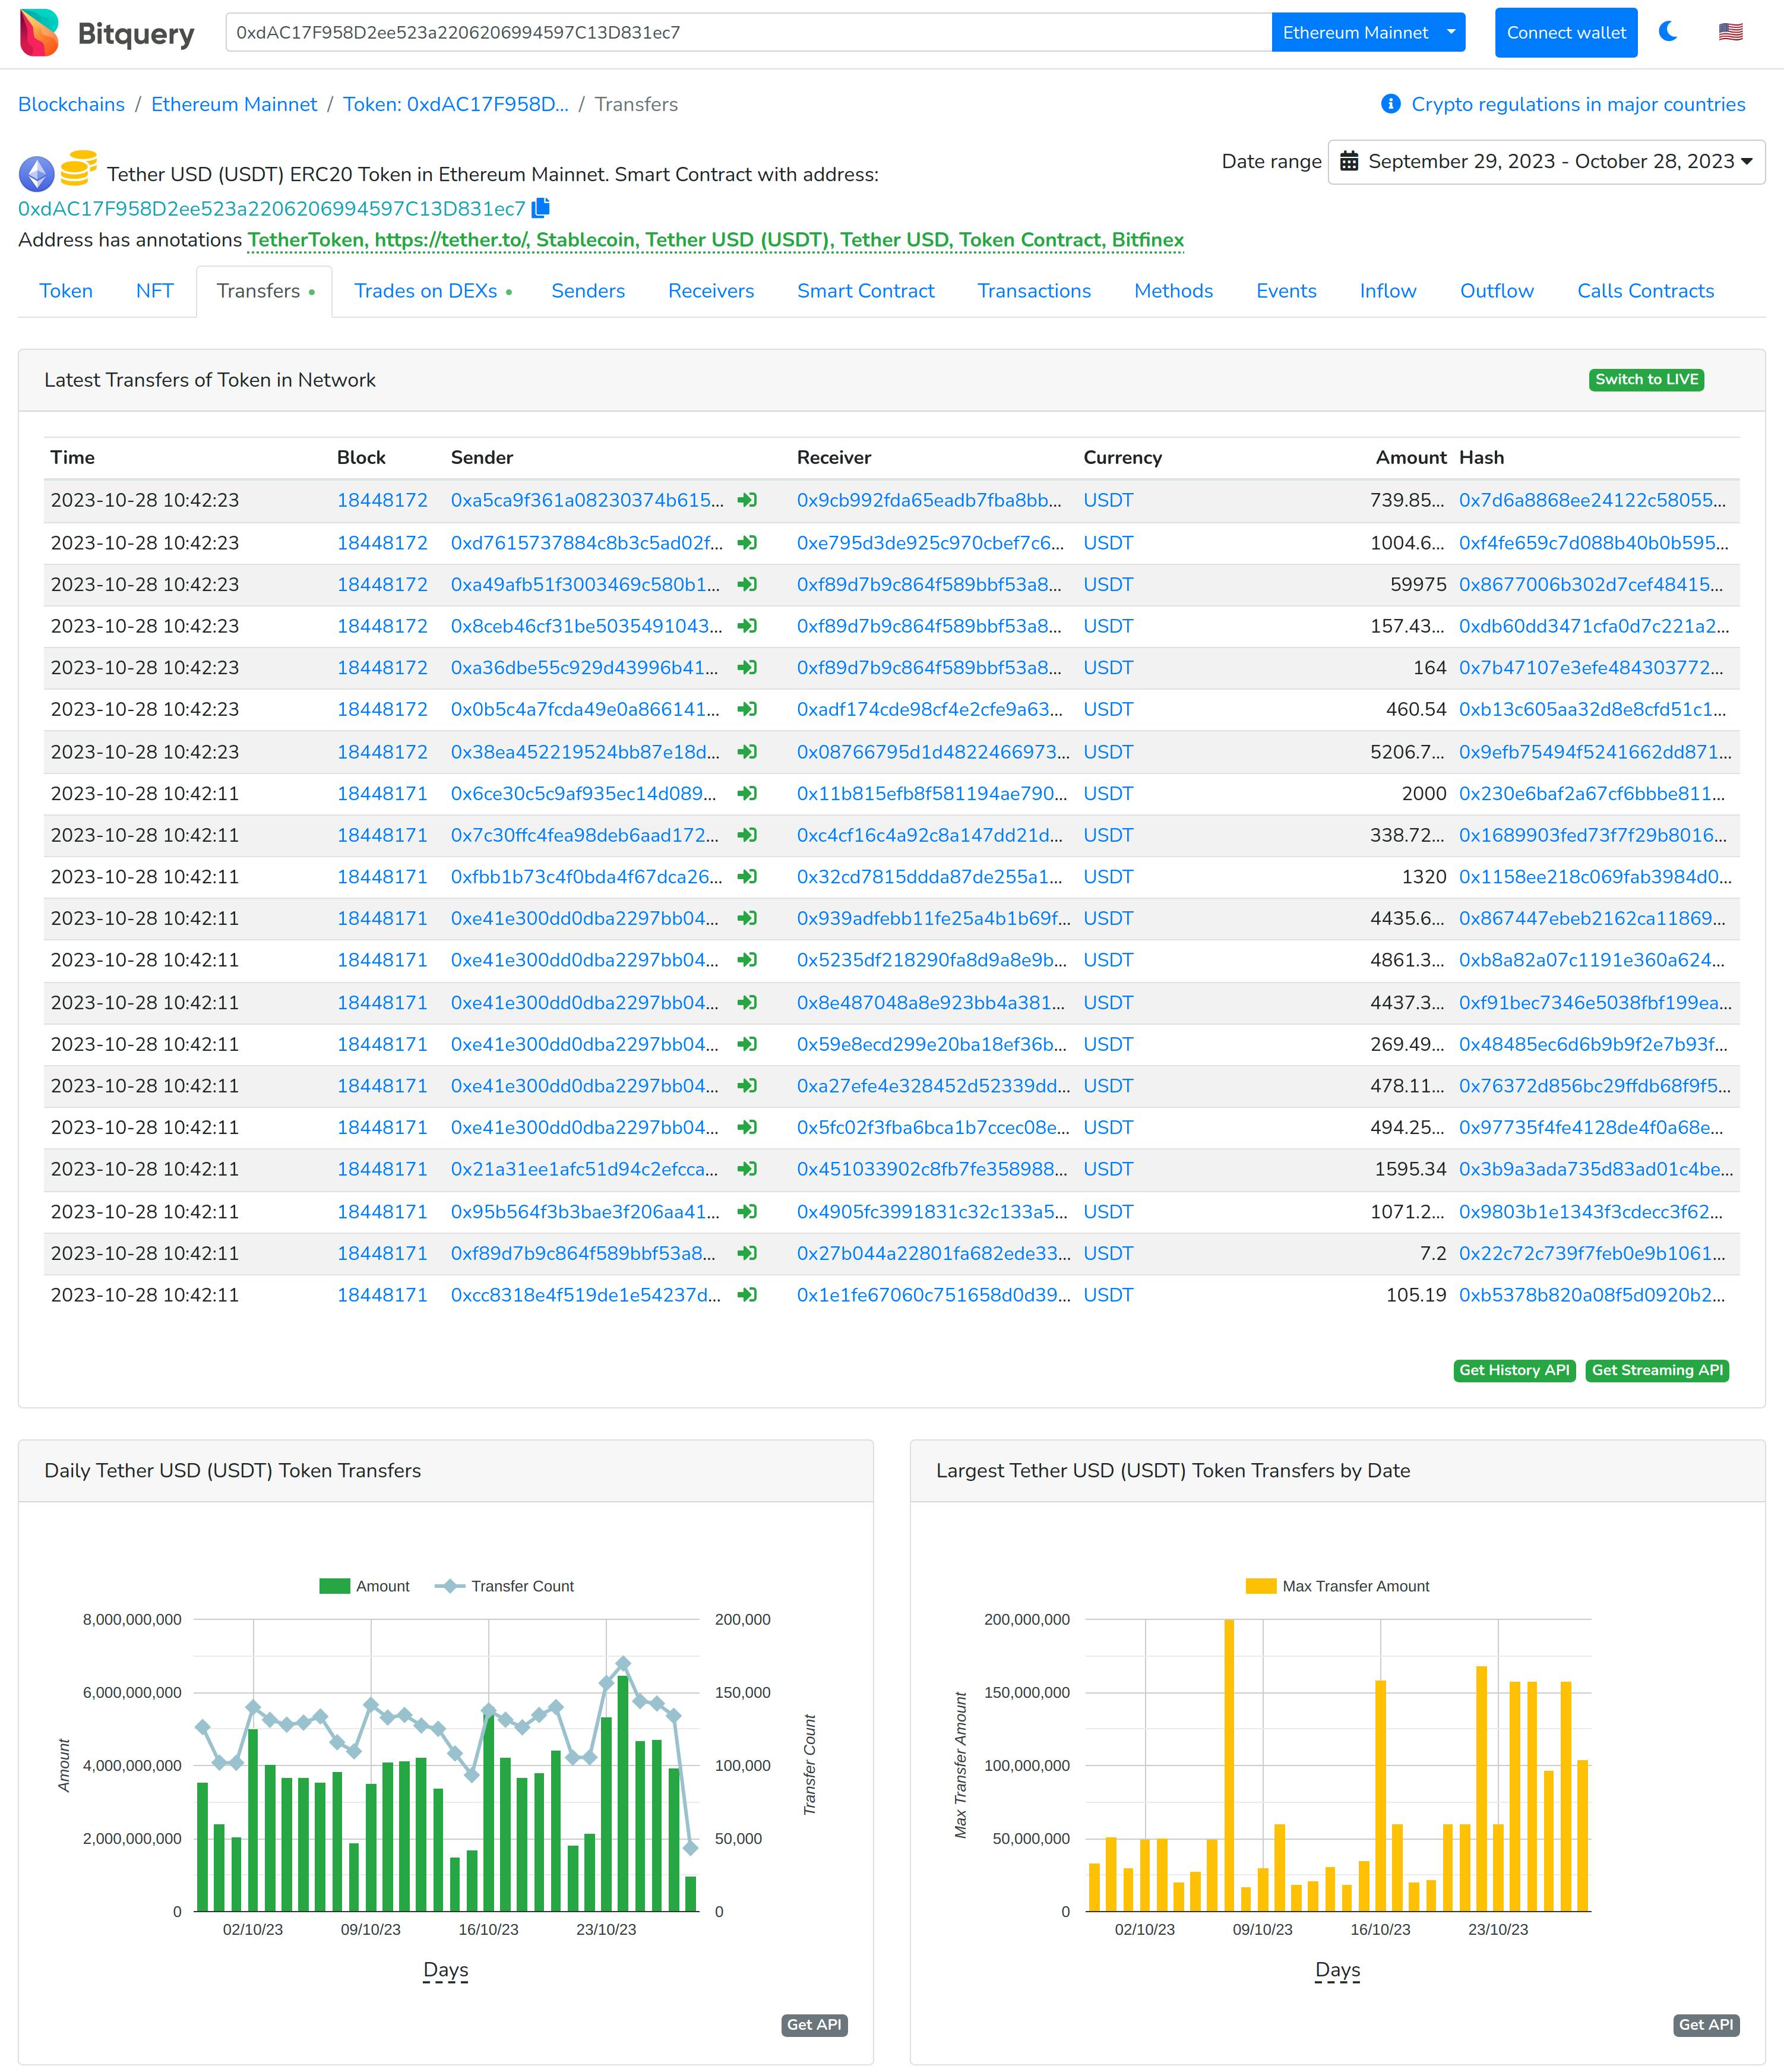
These all data can be used as a comparison to other tokens or to analyse the current market. Here is a blog that Compares USDT to USDC using BitQuery.
There is more to BitQuery than just the explorer; the BitQuery API can be incredibly useful if you want to use blockchain data in your application. BitQuery provides a GraphQL API for querying data from any of the 40+ supported blockchains.
BitQuery GraphQL API
You just need to log in to https://ide.bitquery.io/ to start making the API call. If you are familiar with GraphQL, you will be able to understand the below page easily.
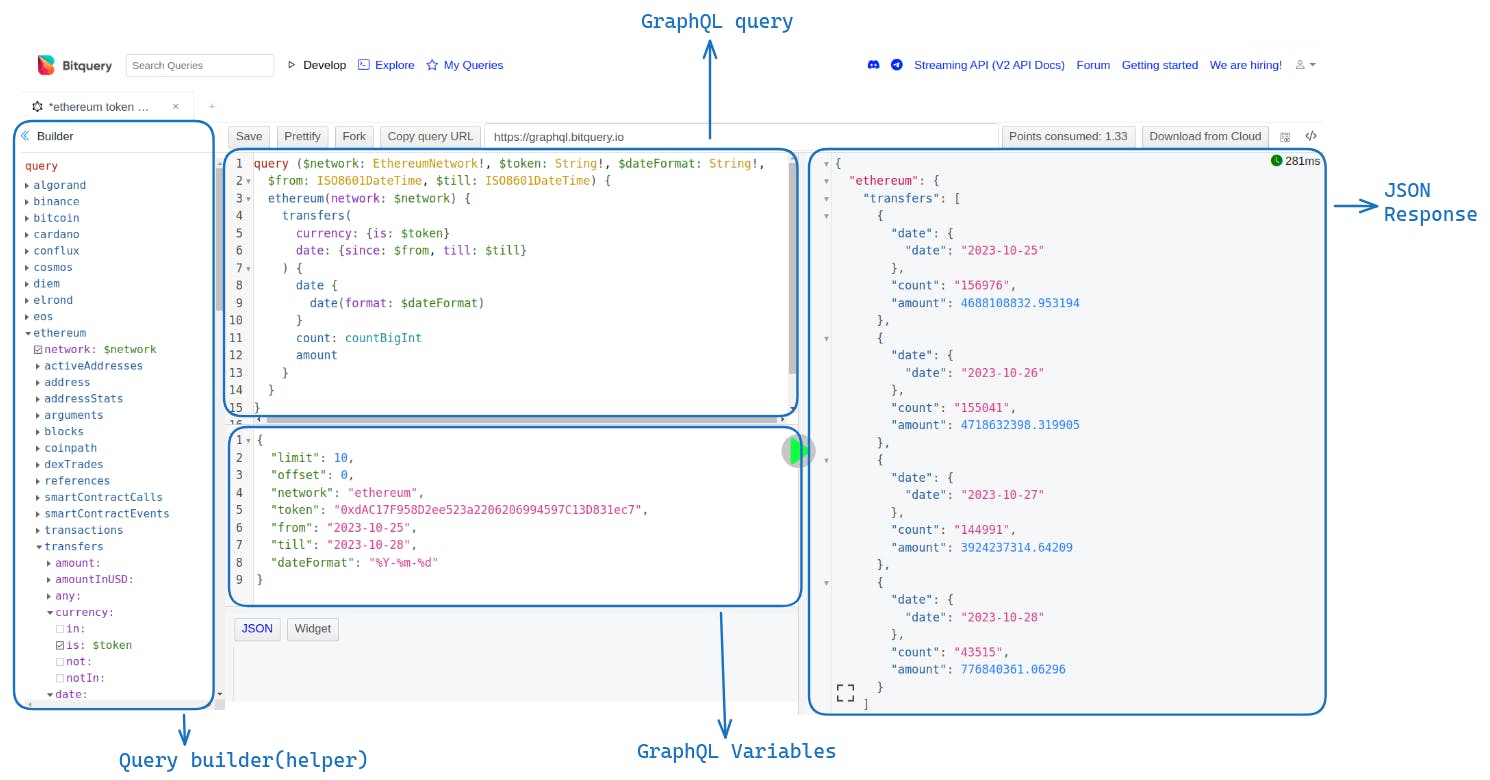
Won't be explaining much in this article but you can play around with any existing API by clicking on the Get API button in the explorer.
If you click on the "Get History API" button, you will be redirected to the BitQuery IDE with the following code. You can experiment with it, and reduce the query to get only the required data. Every API call takes some points, so remember to change the date range so that the API call takes fewer points. The free Developer pack provides 10k points (renewed every month).
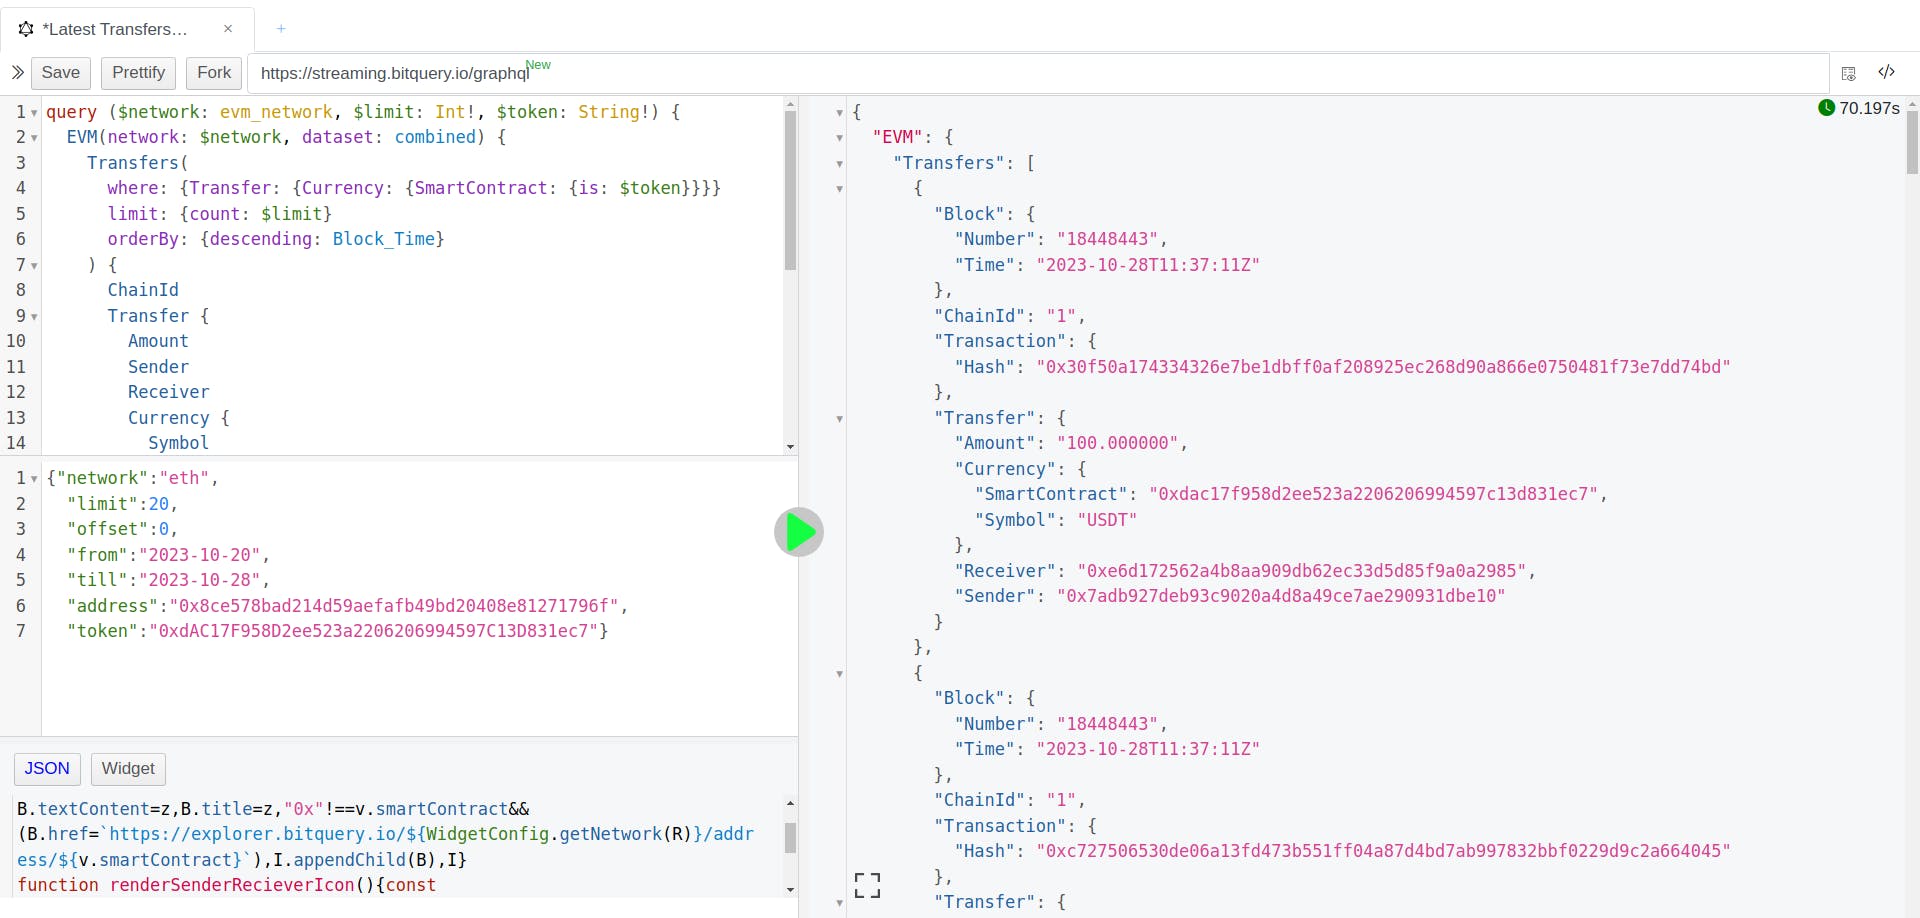
Here is the query I made out of it - Here is an example of the transfer API - https://ide.bitquery.io/Get-Latest-Transfers-on-EthereumEVM-chains